Summary
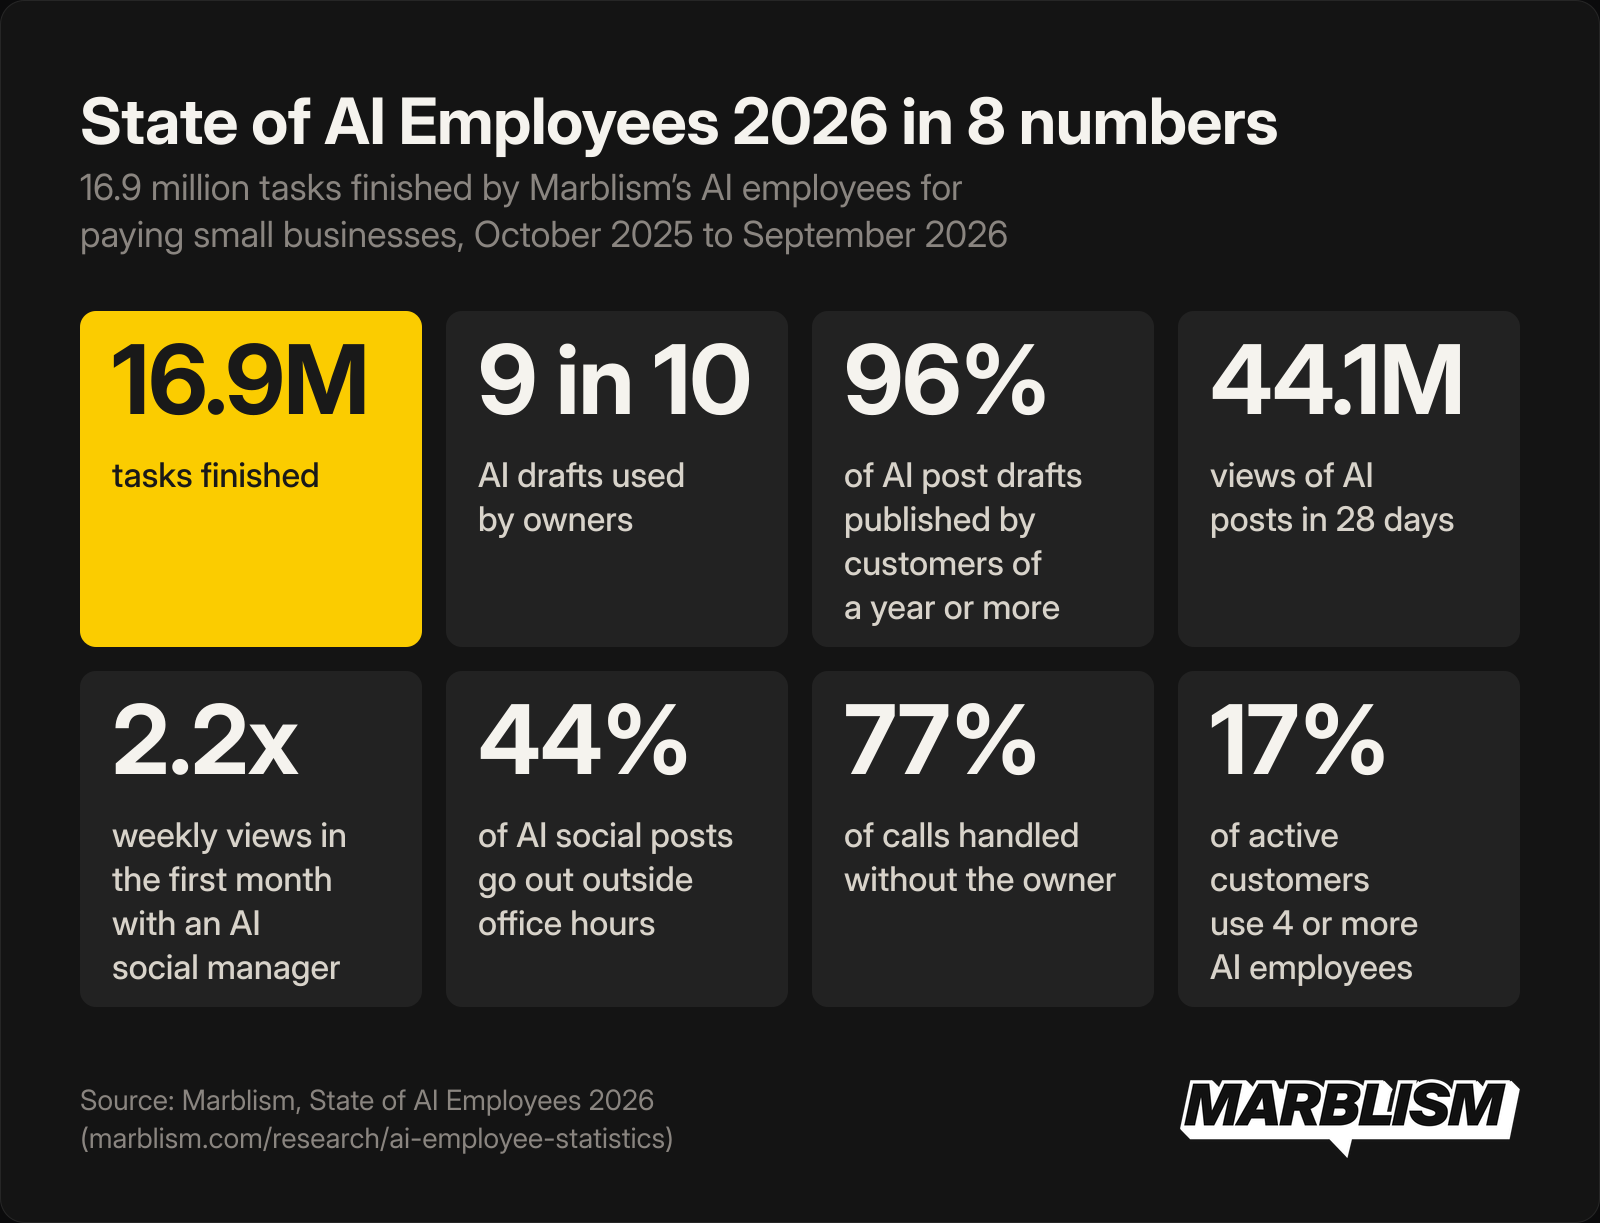
Marblism's 7 AI employees finished 16.9 million tasks for paying small businesses between October 2025 and September 2026, every one of them logged as finished work in Marblism's own records. The number I keep coming back to is trust. Owners used 9 in 10 of the AI drafts they acted on instead of deleting them. Customers of a year or more approved 96% of social posts. 40% of email replies and 29% of calls landed outside office hours, the work an owner would otherwise do at night.
1 Key findings from State of AI Employees 2026
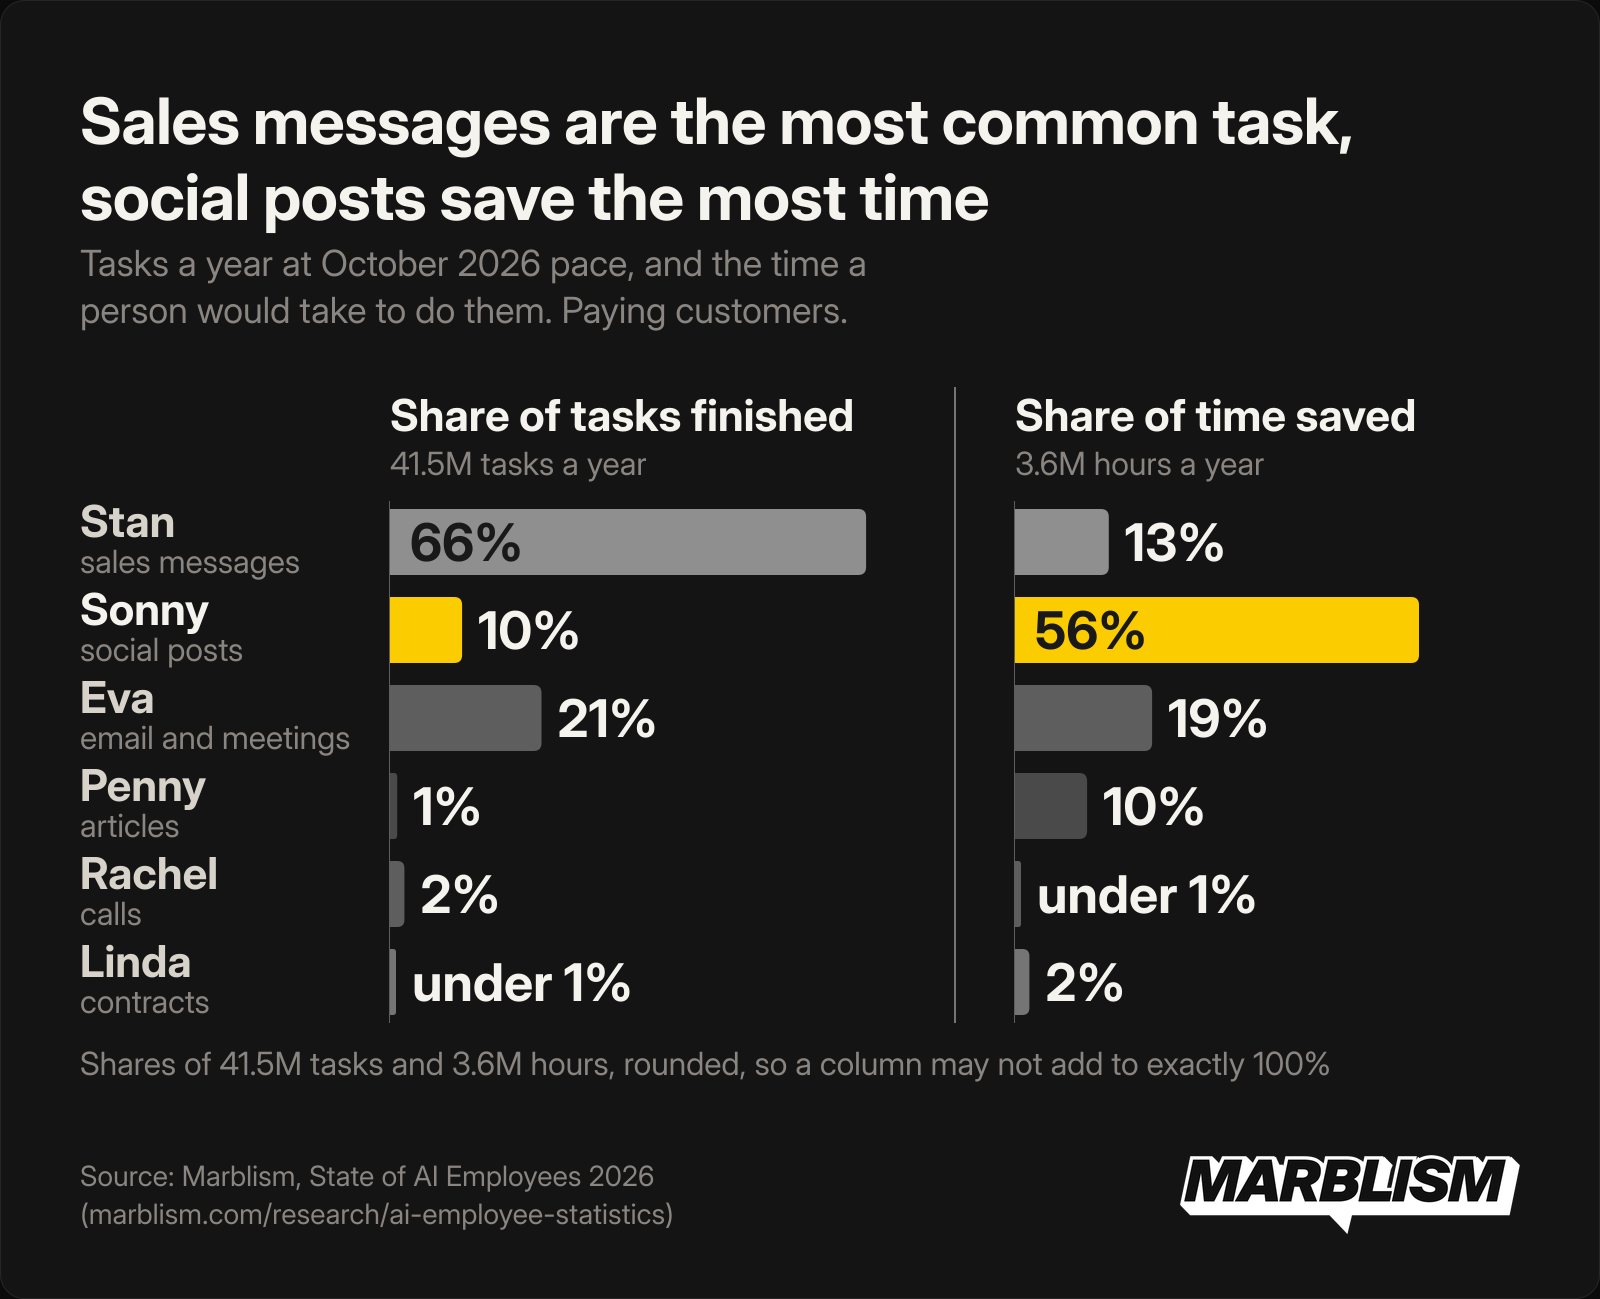
Every figure from Marblism's own data in this report describes its paying customers, October 2025 to September 2026 unless a section says otherwise. At October's pace they are on track to hand over 41.5 million tasks a year, about 3.6 million hours of work that a person would otherwise do.
The findings, with the headline numbers above (Figure 1):
- 1.1
AI-written posts published between 1 and 28 October 2026 drew 44.1 million views, on track for about 575 million views a year.
- 1.2
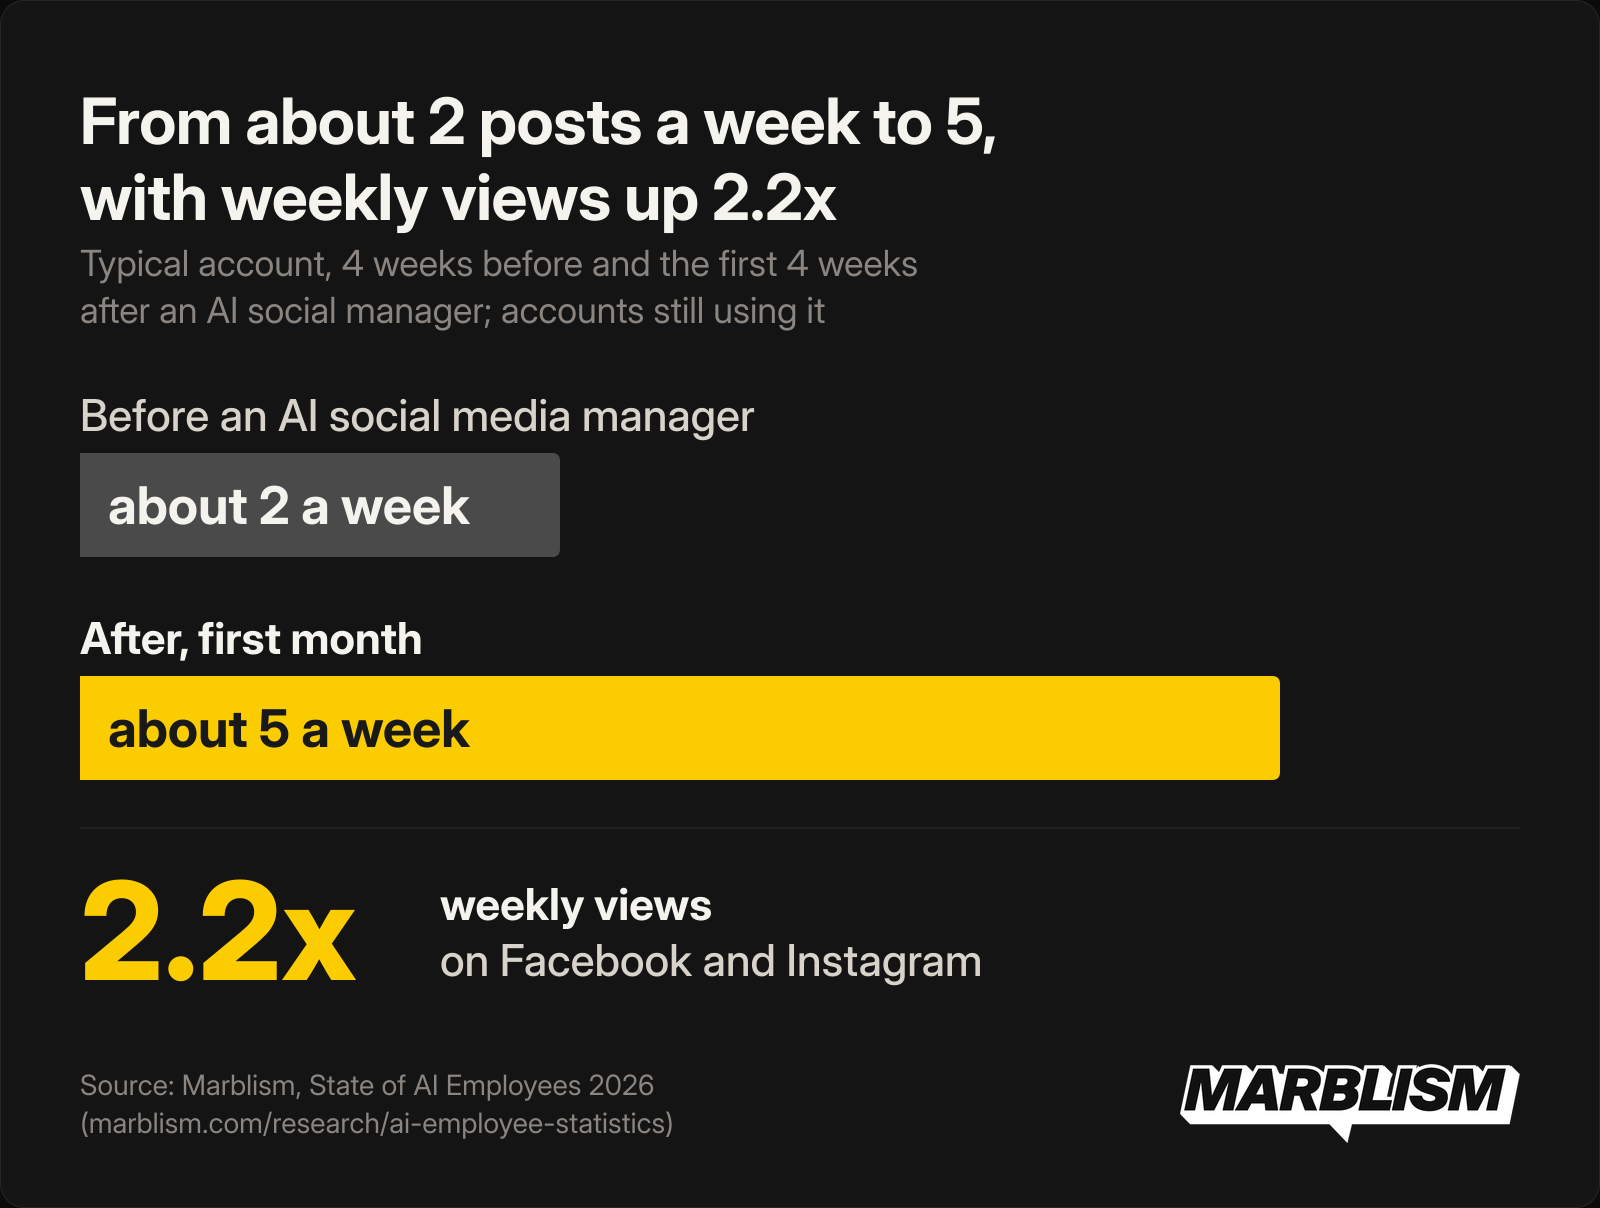
In its first month with an AI social media manager, the typical account went from about 2 posts a week to 5, and weekly views on Facebook and Instagram rose 2.2 times. This is a before-and-after on accounts that stayed, not proof of cause.
- 1.3
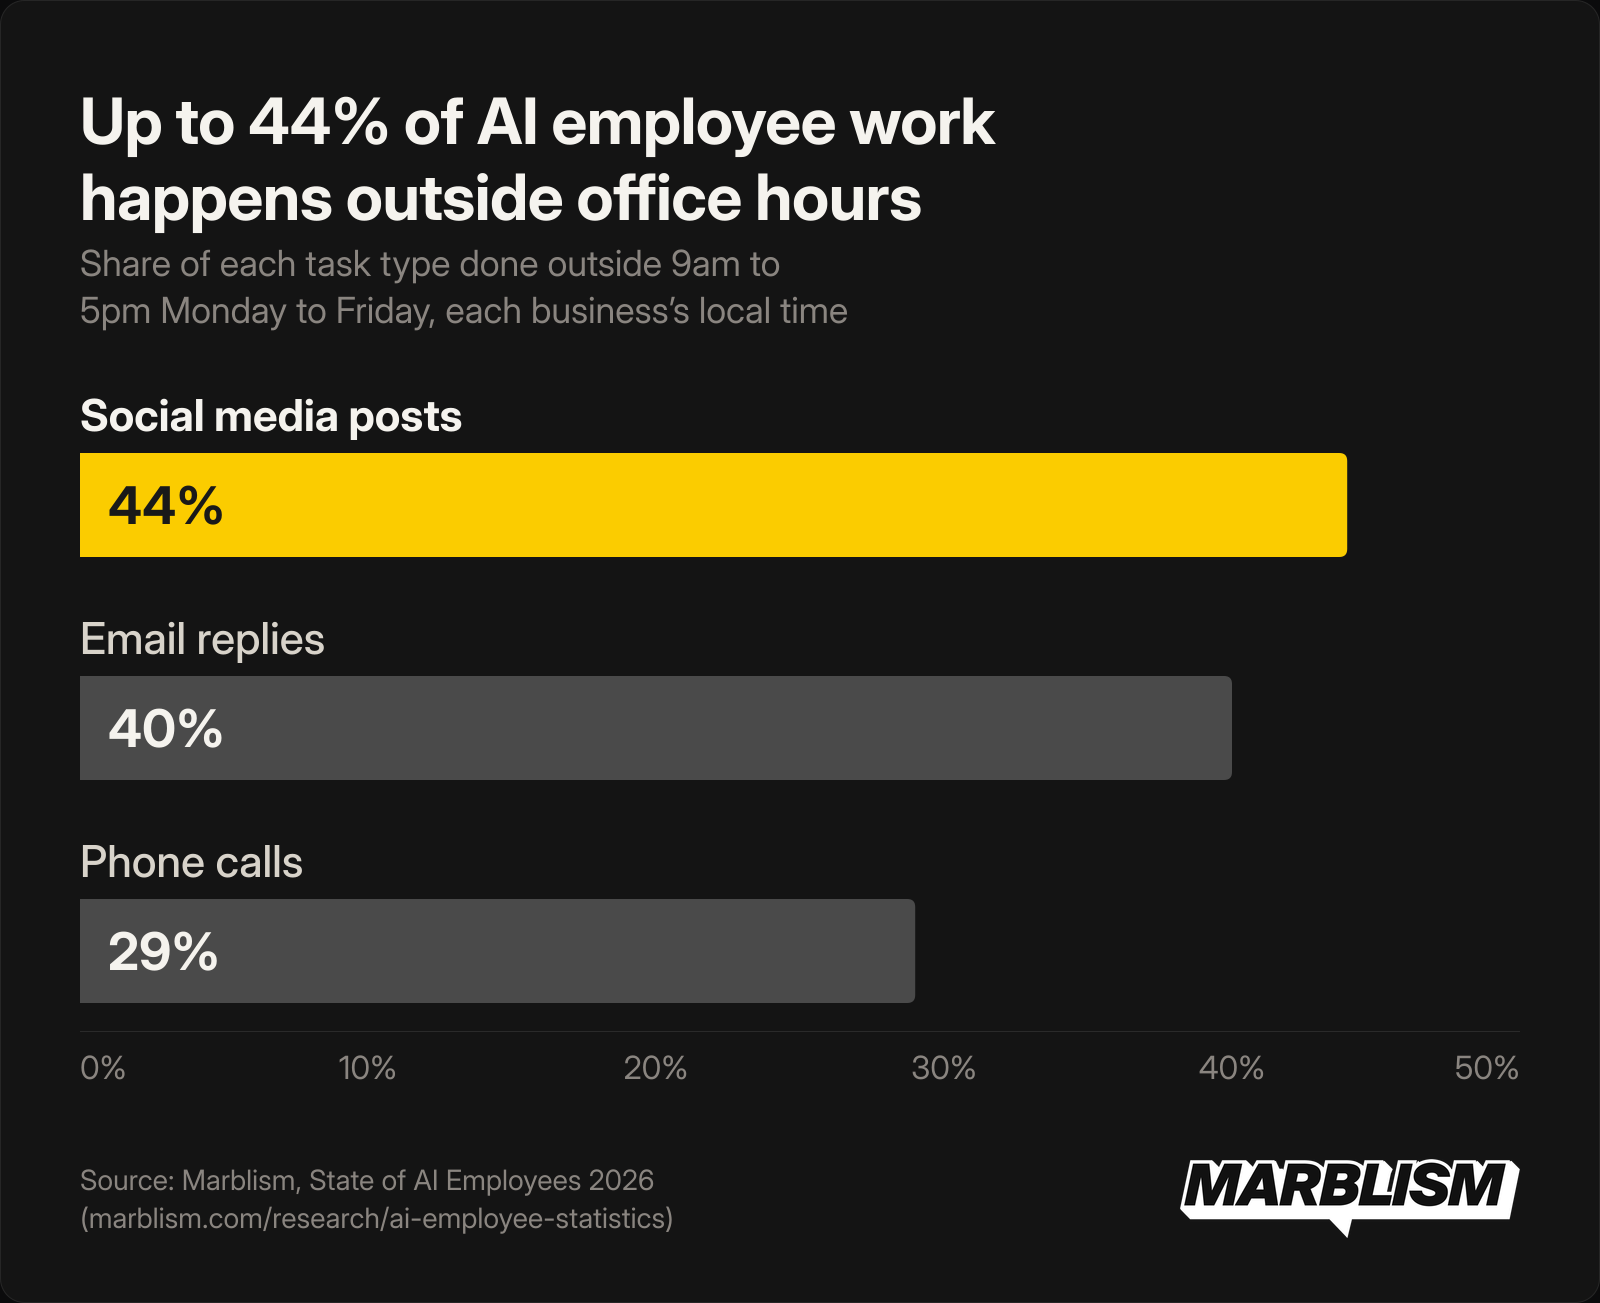
40% of email replies, 29% of phone calls and 44% of social media posts happened outside office hours (9am to 5pm, Monday to Friday, in each business's local time). That is work the owner would otherwise do at night or at the weekend. The AI receptionist dealt with 77% of calls without needing the owner.
- 1.4
Marblism's customers hand 2.8 times more tasks a month to AI employees now than they did at the end of 2025, with Stan's sales messages left out of that comparison. The work going to AI employees is growing quickly.
- 1.5
Owners trust 9 in 10 AI drafts they act on: they use them instead of deleting them. After a year as customers, they publish 96% of social posts.
- 1.6
On Facebook, AI videos get 8.3 times the views of the same business's photos, and video posts have risen from 0.1% of posts in October 2025 to 2.5% in October 2026.
- 1.7
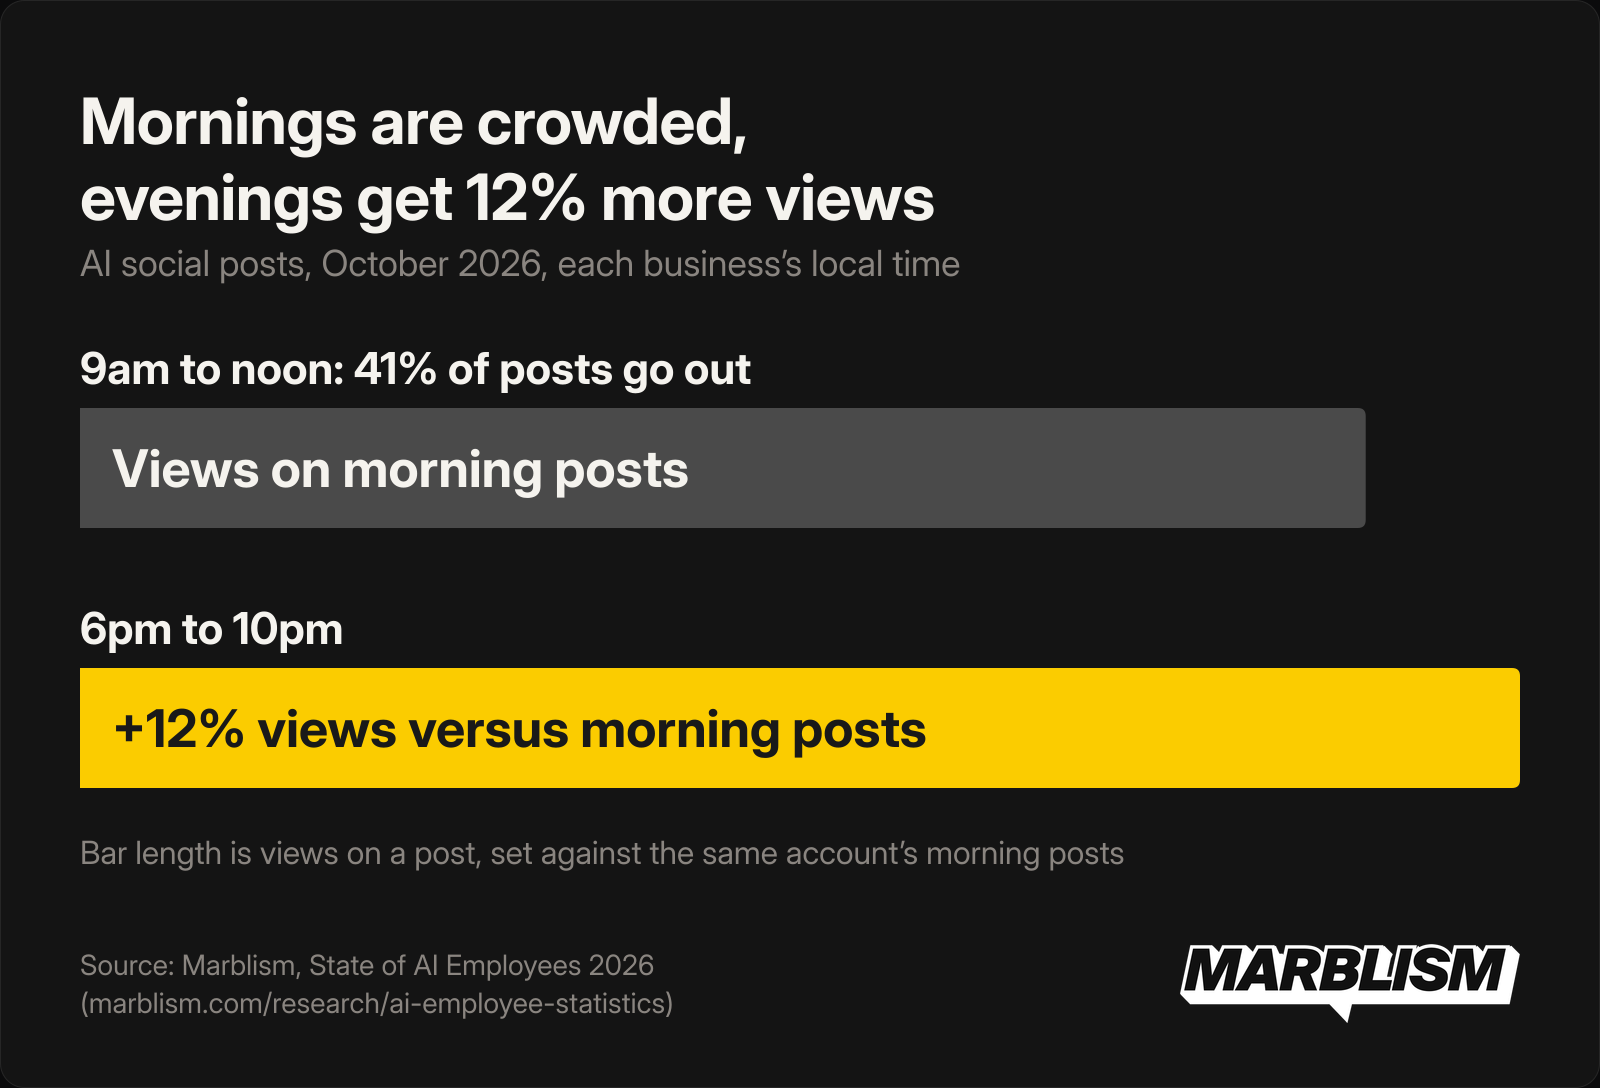
41% of posts go out between 9am and noon, while posts between 6pm and 10pm get 12% more views from the same account.
- 1.8
17% of active customers use 4 or more AI employees. The typical one gets back 6.5 working weeks a year, and half of them run the business alone.
- 1.9
16% of solo owners made an AI video in September 2026, compared with 7% of teams with more than 20 people. Among Marblism's customers, the smallest businesses are the quickest to try video.
Methodology in brief
- Data: Marblism's own database and billing records, paying customers only, October 2025 to September 2026.
- A task is finished work (a reply written, a post published, a call answered). Chats and failed attempts are left out.
- Yearly figures project October 2026's pace to a full year. Time is our estimate at fixed minutes per task. Full method and limits below.
2 Sales messages are the most common task (2 in 3) and social posts save the most time (2.1M hours a year)
There are two ways to measure what Marblism's AI employees did for its paying customers:
- By count: 41.5 million tasks a year at October's pace.
- By time: about 3.6 million hours a year, our estimate of how long a person would take to do the same work.
The two rank the employees differently. A sales message takes about a minute and a social post about half an hour, so Stan sends 2 in 3 of all tasks while Sonny's posts add up to the most time (Figure 2).
| AI employee | Tasks at October's pace (annual) | Time a person would take, per year |
|---|---|---|
| EvaExecutive assistant | Tasks at October's pace (annual)8.4Memail replies, 254K meeting summaries | Time a person would take, per year698Khours |
| SonnySocial media manager | Tasks at October's pace (annual)4.1Mposts, including 114K AI videos | Time a person would take, per year2.1Mhours |
| StanSales assistant | Tasks at October's pace (annual)27.3Msales emails and LinkedIn messages | Time a person would take, per year455Khours |
| RachelReceptionist | Tasks at October's pace (annual)765Kcalls | Time a person would take, per year15Khours |
| PennyContent writer | Tasks at October's pace (annual)362Karticles (498M words) | Time a person would take, per year362Khours |
| LindaLegal assistant | Tasks at October's pace (annual)118Kcontracts | Time a person would take, per year59Khours |
| WalterWebsite builder | Tasks at October's pace (annual)Launched July 2026 | Time a person would take, per yearNot estimated |
Time is our estimate at fixed minutes per task (5 for an email reply, 30 for a social post, 1 for a sales message, 60 for an article, 30 for a contract). Rachel's is real call time. Full method below.
Sales messages are the most common task, social posts save the most time
Penny grew fastest with 5 times the monthly tasks
Growth rates from October-December 2025 to July-September 2026 show Penny moving fastest. Monthly task counts grew:
- Penny: 5.0 times
- Linda: 3.1 times
- Sonny: 2.9 times
- Eva: 2.7 times (measured from a November-December 2025 starting point)
- Rachel: 2.0 times
Stan is left out of the growth comparison because his logging only started in mid-July 2026.
- Penny publishes an estimated 498 million words a year in articles, about 5,500 novels, at October's pace.
- Eva summarizes an estimated 254,000 meetings a year.
- 63% of the websites Walter launched were rebuilt from the business's existing site.
3 Social posts by AI employees drew 44.1 million views in 28 days
Posts Marblism's AI employees published for paying customers between 1 and 28 October 2026 drew 44.1 million views. That is reach the owners got without writing a post themselves. At that pace the posts would draw about 575 million views a year.
Facebook carries 77% of the views
Facebook gets 31% of posts but 77% of views, across posts published from 1 September to 28 October 2026. Google Business Profile doesn't report views, so it is left out.
| Network | Share of posts | Share of views |
|---|---|---|
| 31% | 77% | |
| 26% | 13% | |
| 19% | 5% | |
| X | 7% | 1% |
| 4% | 2% | |
| Threads | 3% | under 1% |
| TikTok | under 1% | under 1% |
Per post, Facebook returns about 5 times what Instagram does. If you are deciding where to put your effort, that gap is the number to start with.
AI videos get 8.3 times the views of photos
On Facebook, any video gets 6.0 times the views of the same account's photos. Sonny's AI videos get 8.3 times, and 4.8 times on Instagram. On Instagram any video gets 3.9 times, and on LinkedIn video makes almost no difference at 1.1 times. Each business is compared with itself, views 48 hours after posting, so a big account is never measured against a small one.
Since August 2026, Sonny can produce short AI videos alongside photo posts. Marblism's records counted 13,700 AI videos since the August launch, putting Marblism on pace for 114,000 AI videos a year and 570 hours of finished AI video a year. 12% of active customers made an AI video in September 2026, the first full month the feature was available.
AI videos average 18 seconds in length and are built for Reels, TikTok and Shorts. 30% of AI-first businesses (those using 4 or more AI employees) made an AI video in September 2026, against 9% of other customers.
Among industries, retail and e-commerce and beauty lead in adoption, against 12% of all active customers:
- Retail and e-commerce: 19%
- Beauty: 15%
- Health care, finance and insurance, and hospitality: 13% each
AI videos get 8.3 times the views of photos on Facebook, yet only 2.5% of posts are videos
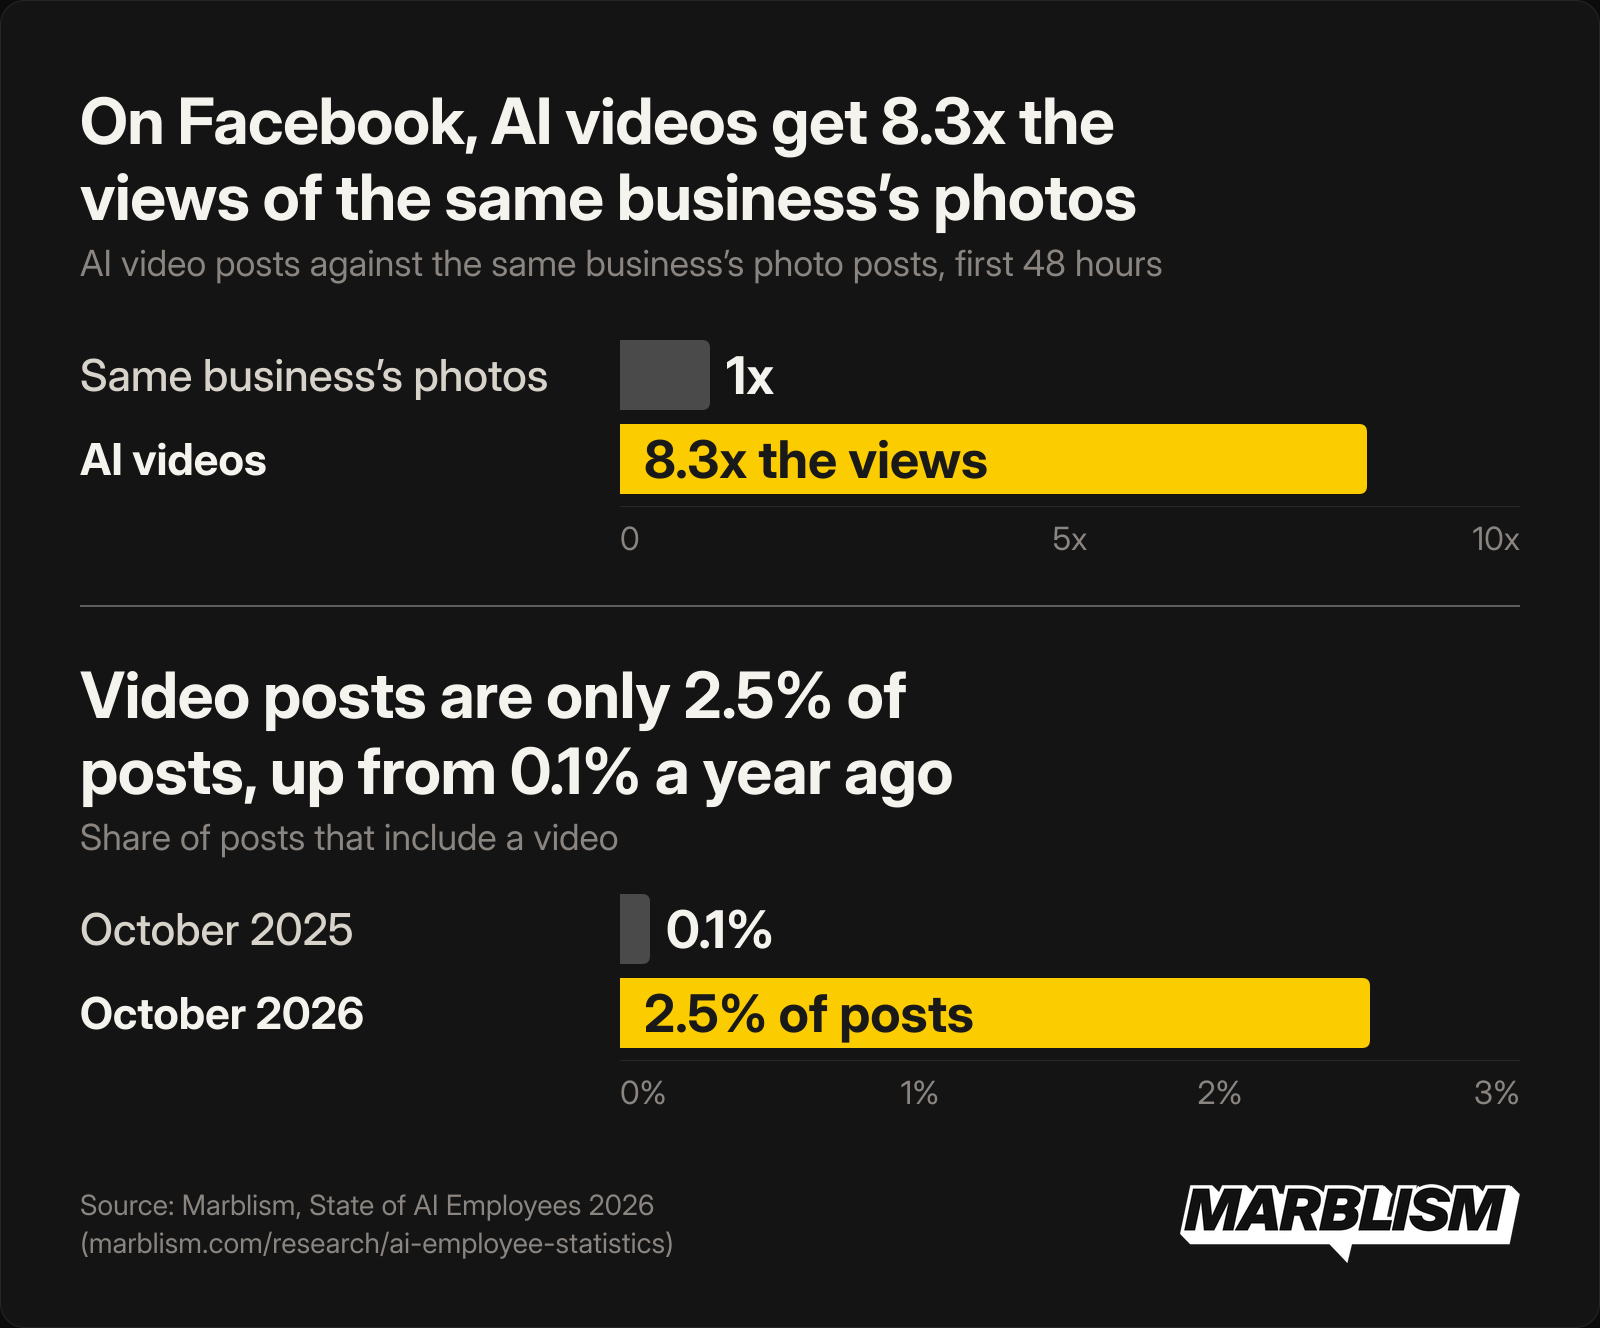
Few posts are video yet: video posts rose from 0.1% of all posts in October 2025 to 1.1% in September 2026 and 2.5% in October 2026 (Figure 3).
Evenings get 12% more views
41% of posts go out between 9am and noon, but posts published between 6pm and 10pm get 12% more views than morning posts from the same account (Figure 4). Weekend posts get 6% more views than weekday posts from the same account.
Mornings are crowded, evenings get 12% more views
From about 2 posts a week to 5 with 2.2 times the weekly views
The sample is a random set of paying accounts that kept using Sonny (at least 5 posts between 1 and 20 October 2026, with 4 weeks of history before). The typical account changed like this (Figure 5):
- Facebook: from 1.5 to 5.2 posts a week, and weekly views 2.2 times higher in the first 4 weeks with Sonny.
- Instagram: from 2.1 to 4.8 posts a week, and weekly views 2.3 times higher in the first 4 weeks with Sonny.
The account posted more than twice as often and was seen about twice as much. 75% of accounts got more weekly views, and 56% at least doubled them.
From about 2 posts a week to 5, with weekly views up 2.2 times
The owner's own posts got about the same views per post after Sonny started as before (1.0 times on both Facebook and Instagram). The report puts the extra views down to posting more often. Because the sample only holds accounts that stayed, I read it as a before-and-after, not proof of cause (full method below).
To see what these numbers look like on your own accounts, Sonny can run your social media.
4 Marblism's AI receptionist dealt with 77% of calls without the owner
Marblism's AI receptionist dealt with 77% of calls without passing them on to the owner, from June to September 2026. That is 77% of ringing phones the owner did not have to pick up. That figure means dealt with, not necessarily resolved to the caller's satisfaction.
Rachel answers the phone, talks to the caller, and passes the call on only when the owner is genuinely needed. At October's pace, that works out to 15,300 hours a year on the phone with callers. More than 7 years of full-time work. If you are comparing phone tools, I keep a separate guide to AI receptionists.
29% of calls were answered outside office hours, and 1 in 9 at the weekend: calls that would otherwise have gone to voicemail or to the owner's evening. Marblism uses each business's local time, with office hours set at 9am to 5pm Monday to Friday.
Across the three kinds of work, social posts lead the off-hours share at 44%, email replies 40%, calls 29% (Figure 6).
Up to 44% of AI employee work happens outside office hours
1 in 10 callers who spoke to Rachel was spam. Rachel stopped 21,000 spam calls in 8 weeks before they reached the owner, from 2 September to 28 October 2026. Those are separate measures from different periods, so I wouldn't add the spam figure to the 77%.
5 Owners trust 9 in 10 AI-generated drafts
Trust here means the owner used the draft instead of deleting it: 9 in 10 of the AI drafts owners acted on in August and September 2026. Social posts and articles came in at 91% and contracts at 85%, counting only the drafts an owner acted on, either to approve or to delete. 91% of published social posts went out without the owner asking for a rewrite. A draft the owner ignored is not in the number, and edits made by hand in the post editor aren't recorded.
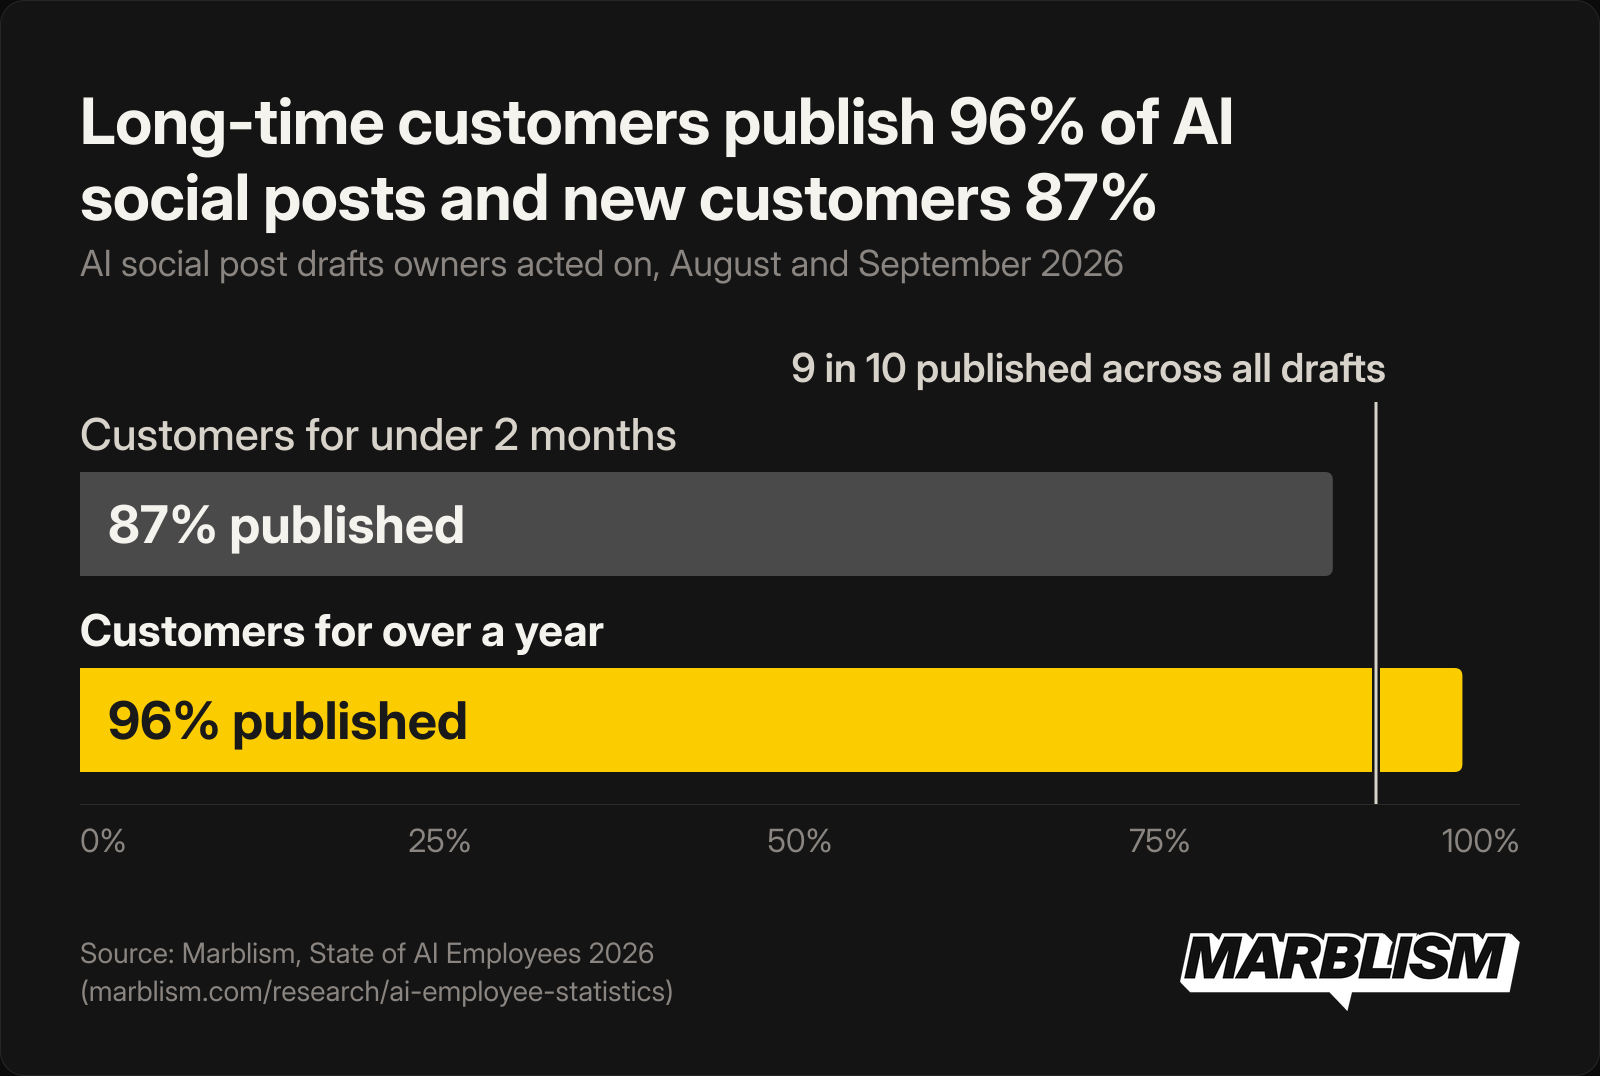
- Owners who have been customers for over a year publish 96% of social posts and publish 95% without asking for a rewrite.
- Owners under 2 months in publish 87% of social posts and publish 80% without asking for a rewrite (Figure 7).
Those are different customers at different stages, so I read it as the owners who stay approving more, not as proof that any one owner changed.
Long-time customers publish 96% of AI social posts and new customers 87%
46% of the email replies owners sent from Eva's drafts went out almost word for word, at least 95% the same as the draft. That covers replies from drafts written between 17 September and 28 October 2026, where the edits could be measured.
6 77% of solo owners hand over social media and 86% of bigger teams hand over the inbox
Among Marblism's customers, the one-person business hands over social media first and the bigger team hands over the inbox.
Solo owners use the social employee at 77% against 49% for teams over 20
- 77% of solo owners use a social media AI employee, against 49% of teams with more than 20 people.
- 86% of teams over 20 use an inbox AI employee, against 77% of solo owners.
Of the customers who shared their team size, 84% have 5 or fewer people and 46% work alone. Solo operators are the centre of this data.
Industry tells a similar story:
- Construction and home services customers use the phone AI employee at 50%, against 43% of all customers.
- Technology and software customers use the sales outreach AI employee at 47%, against 38% of all customers.
- Retail and e-commerce customers use the blog article AI employee at 38%, against 21% of all customers.
| Business type | Hands over | Share using it | Compared with |
|---|---|---|---|
| Solo owners | Social media (Sonny) | 77% | vs 49% for teams over 20 |
| Teams over 20 | Inbox (Eva) | 86% | vs 77% of solo owners |
| Retail and e-commerce | Blog articles (Penny) | 38% | vs 21% of all customers |
| Construction and home services | Phone (Rachel) | 50% | vs 43% of all customers |
| Technology and software | Sales outreach (Stan) | 47% | vs 38% of all customers |
54% of active customers hand over 50 or more tasks a month
In September 2026, 80% of active customers handed over 10 or more tasks in the month, and more than half (54%) handed over 50 or more.
| Tasks per month (September 2026) | Share of active customers |
|---|---|
| Under 10 | 20% |
| 10 to 49 | 26% |
| 50 to 199 | 27% |
| 200 or more | 27% |
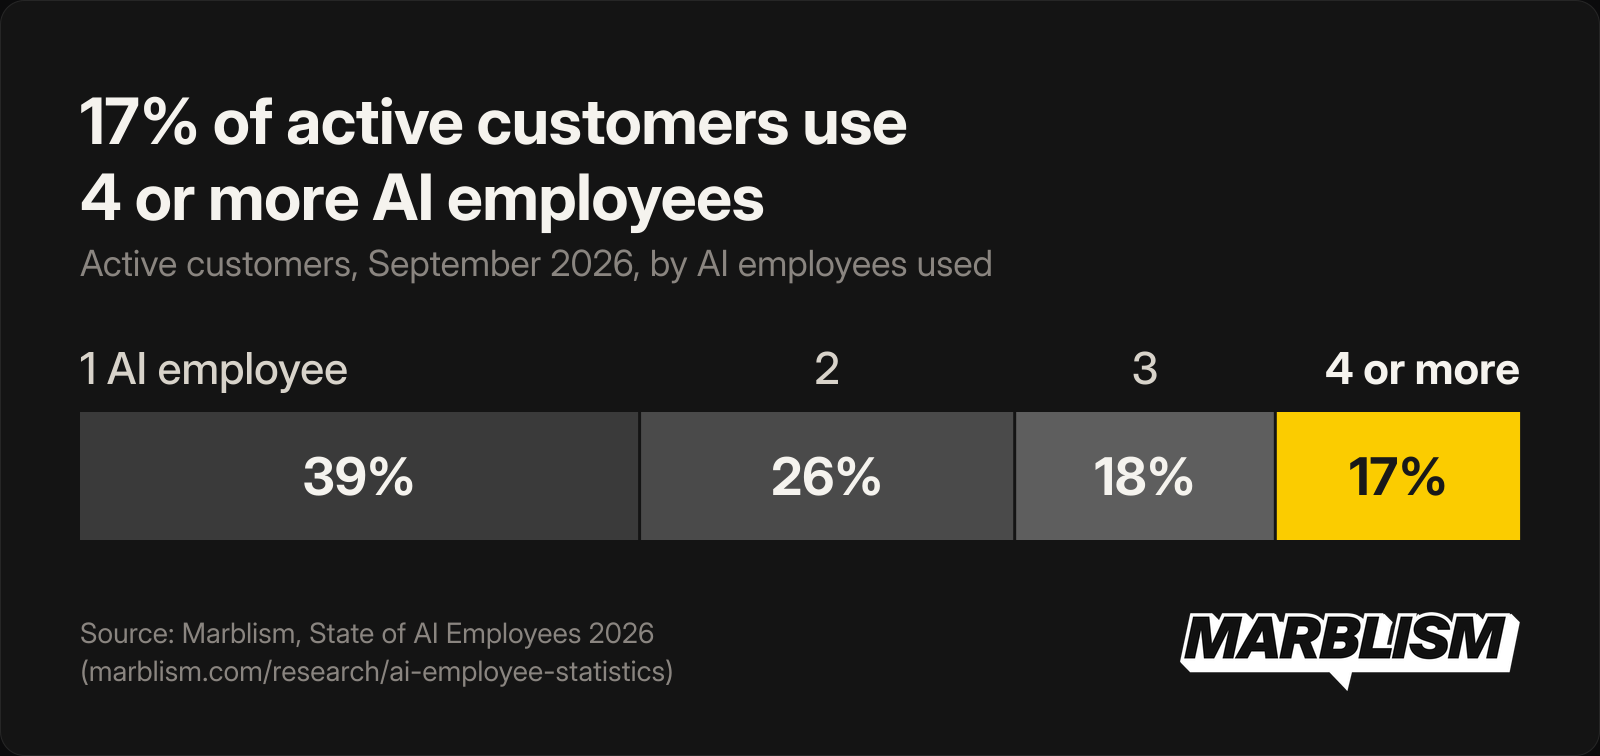
62% of active customers use 2 or more AI employees (the rows below are rounded, so they add to about that).
| AI employees used (September 2026) | Share of active customers |
|---|---|
| 1 | 39% |
| 2 | 26% |
| 3 | 18% |
| 4 or more (AI-first) | 17% |
Marblism calls a business using 4 or more AI employees in the month AI-first. They are 17% of active customers (Figure 8), and half of them are run by one person (50% of those who gave a team size, against 44% of other customers). The typical AI-first business handed over 257 tasks in September 2026, against 42 for other customers. That is a 6-to-1 difference in monthly volume.
Half of AI-first businesses are run by one person, and the typical one saves about 259 hours a year by our estimate, 6.5 working weeks
7 Goldman Sachs finds 76% of owners use AI but 14% have it embedded: what a task count adds
A Goldman Sachs survey of 1,256 owners in its 10,000 Small Businesses programme found 76% report using AI, but only 14% say it is fully embedded in their core operations.
A usage survey asks "do you use AI?" and the answer "yes" covers everything from one experiment in a free trial to 257 tasks handed over in a single month. This report counts only finished work, from paying customers, against a strict definition of what a task is. Those are different questions, and the difference is the whole point.
| Source | What it measures | Population | Period |
|---|---|---|---|
| Goldman Sachs small business AI survey | Self-reported AI use and sentiment | 1,256 Goldman Sachs 10,000 Small Businesses participants, all 50 states, DC and Puerto Rico | January 27 to February 4, 2026 |
| Marblism's own database and billing records (this report) | Finished tasks from paying customers | Marblism's active paying customers | October 2025 to September 2026 |
A common objection is that AI employees are useful for narrow, repeatable tasks and are more assistants than employees. This data partly fits that: about two-thirds of tasks are sales messages that take a minute each, and only 17% of active customers use 4 or more AI employees.
A typical AI-first business, one using 4 or more AI employees, hands over about 259 hours a year of work a person would otherwise do. Customers past a year approve 96% of AI social posts, against 87% for those in their first 2 months. I read that as the clearest answer I have to whether AI employees are real or still demos, and it comes from the customers who stayed.
8 What-if: time saved by AI employees at US scale comes to $230B of work
This is a what-if built on Marblism's AI-first customers, not a measurement. 3 inputs, one output.
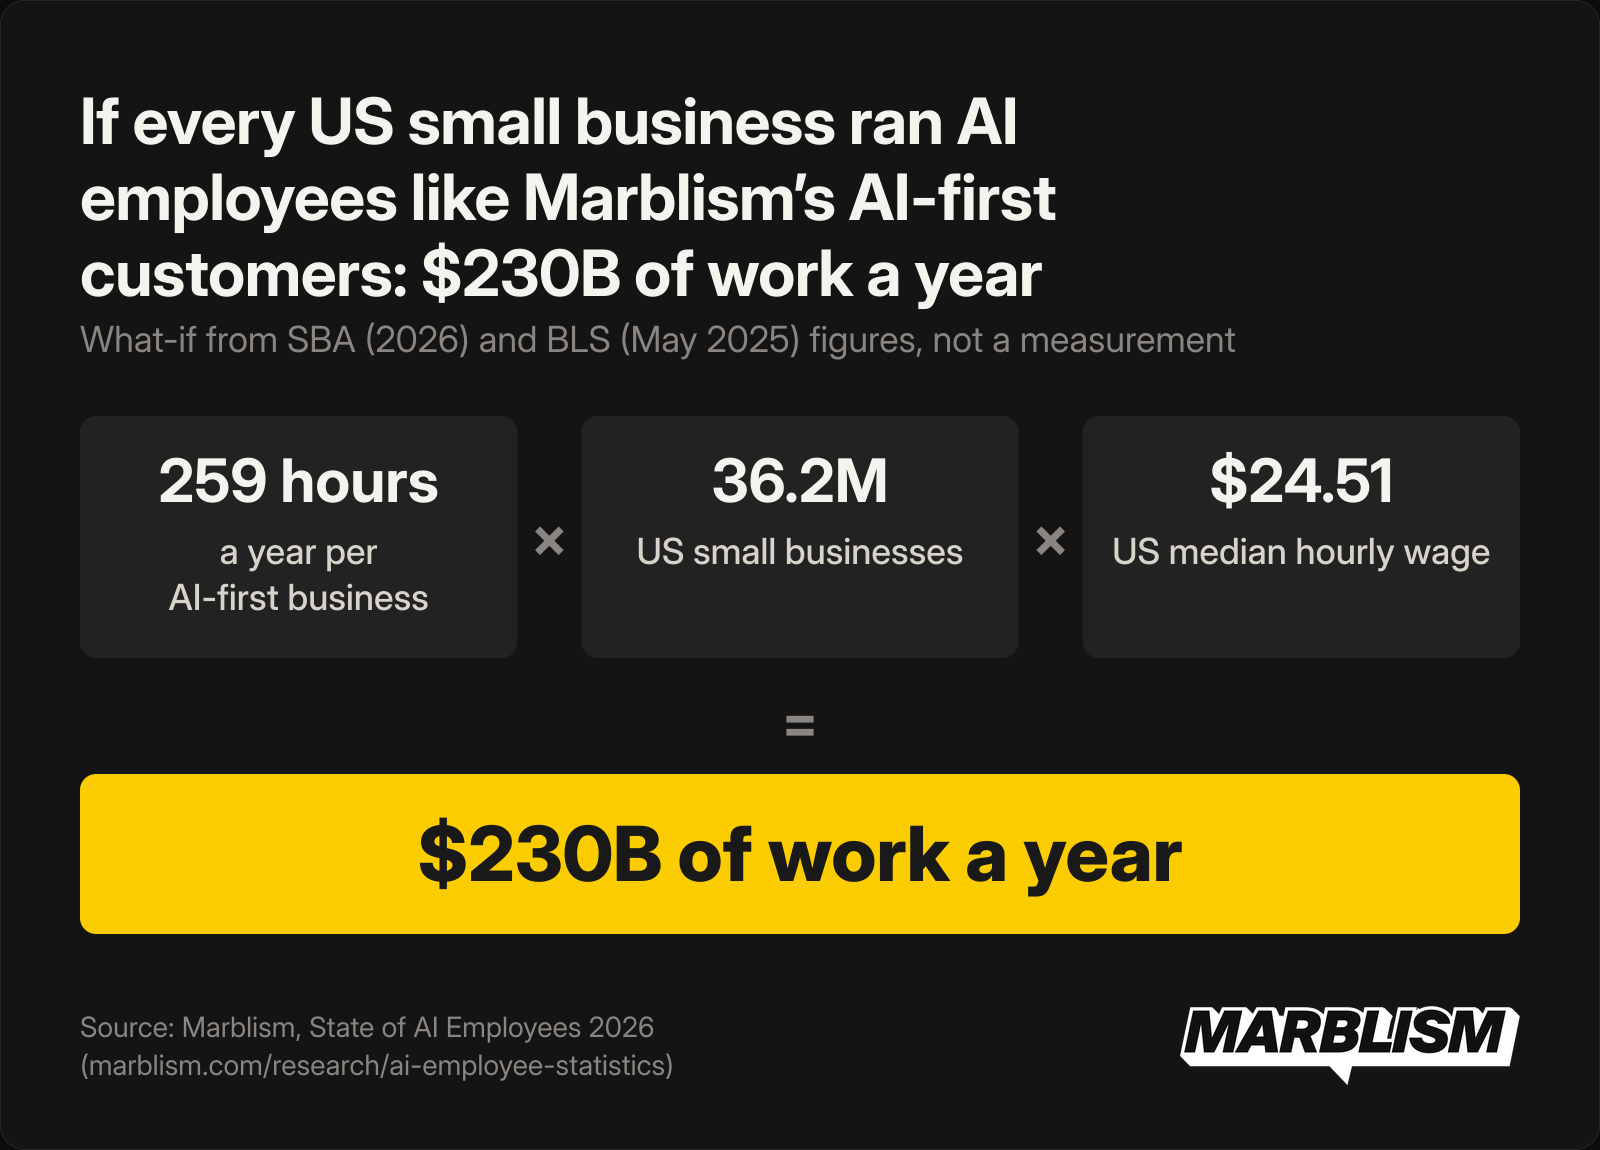
- A typical AI-first business gets back about 259 hours a year by our estimate, 6.5 working weeks.
- There are 36,207,130 small businesses in the United States, according to the SBA Office of Advocacy's 2026 FAQ, and they employ 62.3 million people. Marblism's method notes describe that count as businesses with under 500 employees, one-person businesses included.
- The US annual median wage across all occupations is $50,980 (BLS, May 2025), giving a median hourly rate of $24.51.
259 hours per AI-first business, times 36,207,130 small businesses, valued at $24.51 an hour, comes to roughly $230 billion of work (Figure 9), or more than 9 billion hours of work a year.
That is a what-if, not a forecast. It assumes every US small business runs the way an AI-first Marblism customer does, and you shouldn't take that literally. What the figure gives you is a way to hold the size of the gap between where AI adoption sits today and what full integration would look like. It puts that gap in dollars and hours of work instead of percentages.
If every US small business ran AI employees like Marblism's AI-first customers: $230B of work a year
9 What State of AI Employees 2026 means for a small business
16.9 million tasks finished, 41.5 million a year at October's pace, 91% of social post drafts approved. Those are the 3 numbers that stay with me.
The tasks this report counted are not projections or survey responses. They are finished work from paying customers, October 2025 through September 2026. Behind them sit about 3.6 million hours a year of work a person would otherwise do. The approval rate tells me something the volume numbers cannot: the owners who stay approve more, and that is the direction I'd want to see before handing a whole function over.
4 moves come out of this data:
- Post more often: the typical account went from about 2 posts a week to 5 and weekly views rose 2.2 times.
- Answer after 5pm: 40% of email replies and 29% of calls came outside office hours.
- Post video on Facebook: AI videos got 8.3 times the views of the same business's photos.
- Post in the evening: 6pm to 10pm posts got 12% more views than the same account's morning posts.
They come from Marblism's own customers, so test them on your own accounts before taking them as rules.
What comes next
The 2027 edition will update this report with a full year of Stan and Walter in the counts. I also want to measure what this data could not show: whether the before-and-after holds for accounts that left, and how approvals change once edits made by hand are counted. If you have a question this data could answer, email it to support@marblism.com.
Further reading
10 State of AI Employees 2026: frequently asked questions
How many AI employees are there?
The phrase can mean people who work in the AI industry, people who use AI at work, or software that does a job on its own, the meaning used in this report.
Marblism has 7 AI employees: Eva (executive assistant), Sonny (social media manager), Stan (sales assistant), Rachel (receptionist), Penny (content writer), Linda (legal assistant), and Walter (website builder, launched July 2026). Together they cover inbox, phone, social media, SEO, lead generation, website building, and legal support. Those 7 finished tasks for Marblism's paying customers between October 2025 and September 2026.
What counts as a task in State of AI Employees 2026?
A task is a finished piece of work. For Eva, a reply written or a meeting summed up. For Sonny, a post published. For Stan, a sales email or LinkedIn invite or message sent. For Rachel, a call answered, meaning a real conversation and not a test call. For Penny, an article published. For Linda, a contract drafted. For Walter, a website launched or updated.
Chats and failed attempts do not count. Only finished work goes in: a reply written, a post published, a contract drafted. That is a strict definition.
Who is in the State of AI Employees 2026 data?
The data covers Marblism's paying customers only. An active customer is a paying account that finished at least one task in the month being measured.
Of the customers who shared their team size, 84% have 5 or fewer people and 46% work alone. 72% of active customers are in the US and 13% are in the UK. These are businesses that chose to hand work to AI employees and have already cleared the hurdle of signing up and paying. That matters when you read the volume and approval figures. This is not a random cross-section of small business owners.
A How this report was built
Everything in this report comes from Marblism's own database and billing records. It is not a survey, and it covers paying customers only. A paying account counts as active if it finished at least one task that month. The data runs from October 2025 through September 2026 unless a section says otherwise.
A task is a finished piece of work:
- An email reply written
- A meeting summed up
- A social post published
- A sales email or LinkedIn invite or message sent
- A website launched or updated
- An article published
- A call answered (a real conversation, not a test call)
- A contract drafted
Chats and failed attempts do not count.
Yearly figures are projections, not measured counts. The projection takes the count from 1 to 28 October 2026, divides it by 28, then multiplies by 365.
Time estimates use assumed minutes per task:
- Email reply: 5 minutes
- Social post: 30 minutes
- Sales email or LinkedIn message: 1 minute
- Article: 60 minutes
- Contract: 30 minutes
Rachel is the exception: real phone time is used. Meeting summaries and Walter don't feed into the time figures.
Figures are rounded, so the tasks column doesn't add exactly to 41.5 million. Sonny's 114K AI videos are counted within the 4.1M posts. A published social post is a task, with no separate video-task category. The time column adds to about 3.7 million hours against the report's 3.6 million because Sonny is rounded up from about 2.05 million.
Stan's messages are logged starting 14 July 2026. Walter and AI video both came later: Walter in July 2026, AI video in August 2026.
Growth comparisons include Eva, Sonny, Penny, Rachel, and Linda. Eva's baseline is November and December 2025. Stan is excluded from the over-time comparisons.
Approved means the owner published or scheduled the draft (posts and articles) or downloaded it (contracts), counted against drafts they either approved or deleted. For Eva, the window covers replies sent from drafts written between 17 September and 28 October 2026, where the edits could be tracked. Word for word means 95% or more of the text stayed the same.
Views are what each network reports, compared per account with itself using views 48 hours after posting.
The spam share counts only callers who reached Rachel and actually spoke with her.
The Facebook and Instagram before-and-after draws from a random sample of paying accounts with at least 5 Sonny posts between 1 and 20 October 2026. Those accounts also need post history going back 4 weeks before Sonny's first post. Accounts that stopped using Sonny are not in the sample.
Industries are grouped into 16 sectors. Team size is the owner's own answer, and about half answered. Only counts are used, never content, and no number covers fewer than 20 customers.
The what-if starts with 259 hours a year, the time a typical AI-first business saves by our estimate at October's pace. That figure is multiplied by 36,207,130 US small businesses (SBA Office of Advocacy, February 2026, a count Marblism's method notes describe as under 500 employees, one-person businesses included). The result is valued at the US median wage of $24.51 an hour (BLS, May 2025, all occupations).
AI-first businesses are accounts that used 4 or more AI employees in the month.
What this data does not claim:
- It does not describe small businesses in general. It describes Marblism's paying customers.
- Yearly figures are projections at October's pace. Of task totals, the one full-period count is the 16.9 million tasks from October 2025 to September 2026.
- Hours are estimates of what the same tasks would take a person. They are not Marblism's plan hours, and the two should not be compared.
- 259 hours and 6.5 weeks describe a typical AI-first business, 17% of active customers, not the typical customer.
- 77% means dealt with without passing the call to the owner. It does not say resolved, booked or satisfied.
- Approved leaves out drafts the owner ignored and edits made by hand. It does not mean 9 in 10 drafts were perfect.
- 2.8 times leaves Stan out, and Eva's starting point is November and December 2025.
- The before-and-after on views is a sample of accounts that stayed. It does not prove the cause.
- Team size is self-reported, and about half answered.
- $230 billion is a what-if, not a forecast or a measurement.
Marblism's separate benchmark of AI products is a different dataset and is not part of this report.
Cite this report
Marblism (2026). State of AI Employees 2026: 16.9M tasks analyzed. Based on Marblism's own database and billing records, October 2025 to September 2026. marblism.com/research/ai-employee-statistics
Charts are free to reuse with a link to marblism.com/research/ai-employee-statistics.
